Analysis of Tuesday trades:
EUR/USD 30M chart
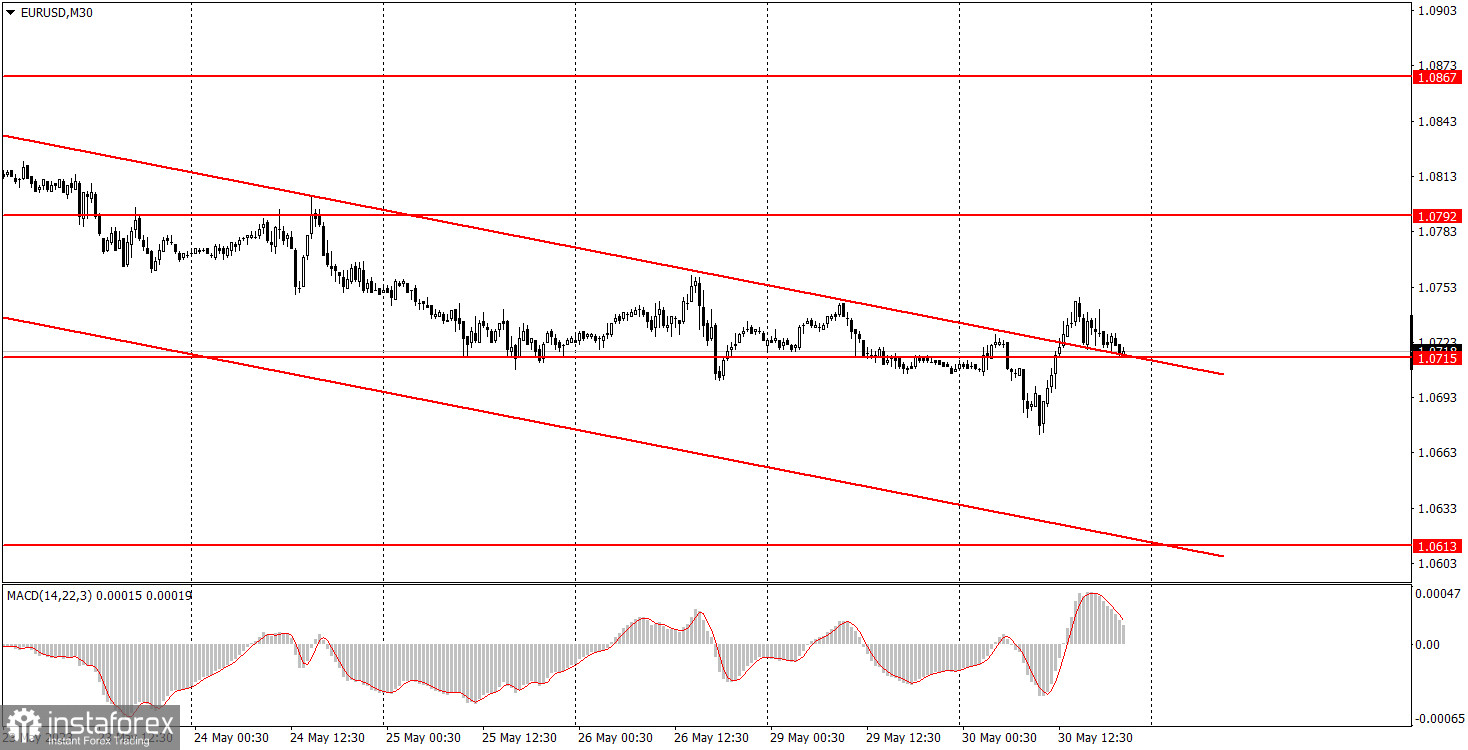
The currency pair EUR/USD continued to trade sideways during Tuesday and broke out of the descending channel. Yesterday, we warned that the breakout from the channel during a flat trend would not be a strong signal for the start of an upward trend. We believe that the decline in the euro may continue for some time despite the breakout from the channel. There was no macroeconomic data or fundamental background on Monday for traders to react to, yet the pair showed some decent movements. However, we consider them to be purely technical in nature. It would be wrong to say that the dollar lost ground today. An upward correction is round the corner, but for now, we only see a flat pattern. In the medium-term perspective, the pair is expected to continue its decline, but it may take a pause for a while.
EUR/USD 5M chart
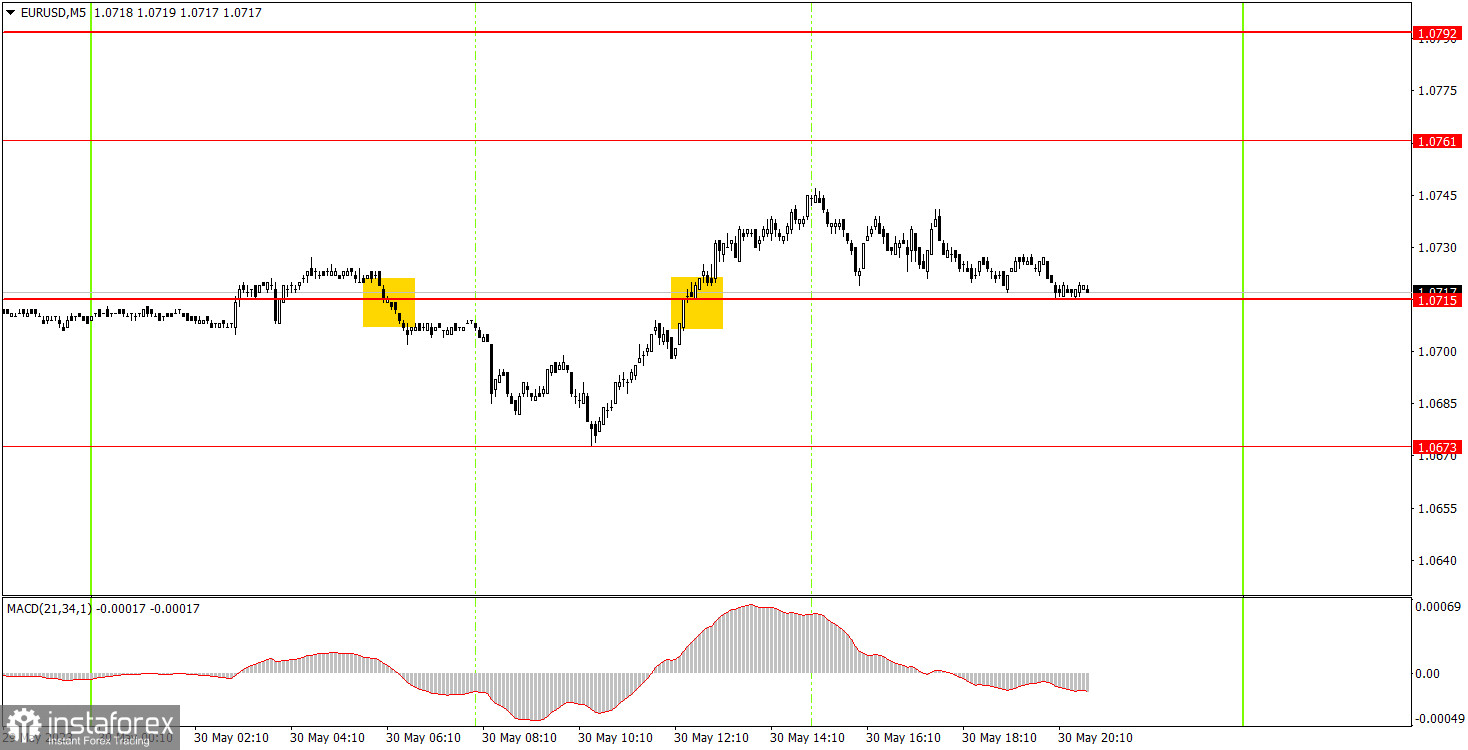
On the 5-minute timeframe on Tuesday, only two trading signals were formed. Initially, the pair dropped below the level of 1.0715 overnight. Still, this signal could have been executed because at the opening of the European trading session, the price did not deviate significantly from the formation point. It moved down by approximately 35 pips. Then, a buy signal was formed around the same level of 1.0715, and the price moved in the right direction by 15 pips. In both cases, a stop-loss order should have been placed at breakeven. Profit could only be obtained from the first trade, and only if it were manually closed. Overall, the volatility was not particularly high, but there was no loss incurred.
Trading plan for Wednesday:
As seen on the 30-minute timeframe, the pair continues moving downward despite breaking out of the descending channel. Currently, a flat phase may begin, but the macroeconomic background of the remaining three days does not suggest prolonged sideways movement. It can have a significant impact on the pair's movement. On the 5-minute timeframe, tomorrow's key levels can be found at 1.0607-1.0613, 1.0673, 1.0715, 1.0761, 1.0792, 1.0857-1.0867, and 1.0918-1.0933. Once the price moves 15 pips in the right direction, you can set a stop-loss order at breakeven. On Wednesday, there is a scheduled speech by ECB head Christine Lagarde and the release of the JOLTs Job Openings report in the US. Additionally, there will be several speeches by representatives of the Federal Reserve. This should be sufficient to stir some market reaction, so the volatility may gradually increase.
Basic principles of a trading system:
1) The strength of the signal depends on the time period during which the signal was formed (a rebound or a break). The shorter this period, the stronger the signal.
2) If two or more trades were opened at some level following false signals, i.e. those signals that did not lead the price to Take Profit level or the nearest target levels, then any consequent signals near this level should be ignored.
3) During the flat trend, any currency pair may form a lot of false signals or do not produce any signals at all. In any case, the flat trend is not the best condition for trading.
4) Trades are opened in the time period between the beginning of the European session and until the middle of the American one, when all deals should be closed manually.
5) We can pay attention to the MACD signals in the 30M time frame only if there is good volatility and a definite trend confirmed by a trend line or a trend channel.
6) If two key levels are too close to each other (about 5-15 pips), then this is a support or resistance area.
How to read charts:
Support and Resistance price levels can serve as targets when buying or selling. You can place Take Profit levels near them.
Red lines are channels or trend lines that display the current trend and show which direction is better to trade.
MACD indicator (14,22,3) is a histogram and a signal line showing when it is better to enter the market when they cross. This indicator is better to be used in combination with trend channels or trend lines.
Important speeches and reports that are always reflected in the economic calendars can greatly influence the movement of a currency pair. Therefore, during such events, it is recommended to trade as carefully as possible or exit the market in order to avoid a sharp price reversal against the previous movement.
Beginning traders should remember that every trade cannot be profitable. The development of a reliable strategy and money management are the key to success in trading over a long period of time.